Tuesday, August 11, 2020

The Electoral College Map (8/11/20)

Update for August 11.


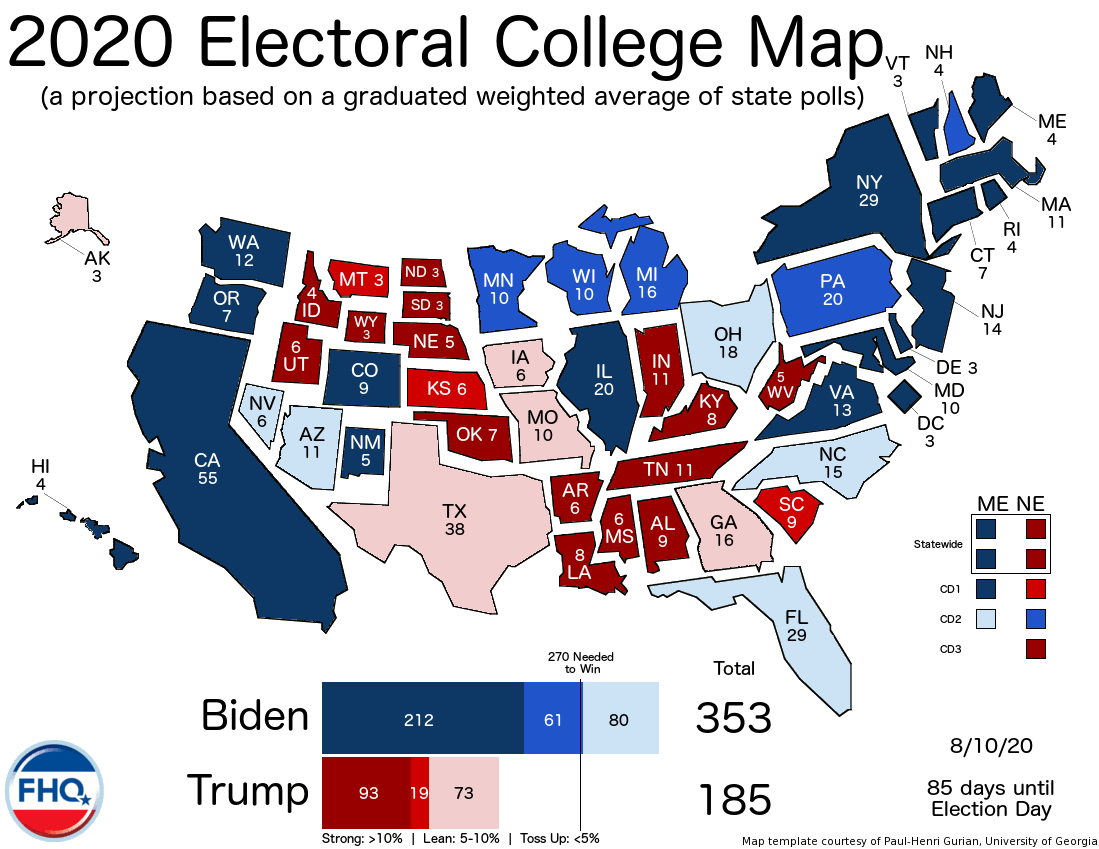
With 12 weeks now until election day, the race for the White House continued on a fairly steady course through the lens of the FHQ graduated weighted averages. Biden holds onto a sizable projected lead in the Electoral College, and while Trump has leveled off some of late in national and state-level polls, Biden may have seen his pre-convention peak in July. And while there is some evidence in the state-level polls that the former vice president has seen his share of support trail off, his advantages where it counts -- around the tipping point state -- present challenges for an incumbent president attempting to get back in the race.


Polling Quick Hits:
Georgia
(Biden 46, Trump 44 via Survey USA | Biden 44, Trump 40 via HIT Strategies):
But the hunt for that evidence does not really extend into Georgia; at least not in these two polls. Just a simple average of the Peach state polls since the beginning of July has Biden and Trump knotted at 46 percent apiece. And neither of these polls strays too far from that. Yet, both find Biden narrowly ahead. And while that is the case, neither provided enough statistical oomph to push the Peach state over the partisan line and into Biden territory. However, together the polls cut into Trump's already small edge there. Georgia is now the most competitive of the Trump toss ups.


Maine
(Biden 45, Trump 38):
Up the Appalachian Trail in Maine, Critical Insights also found Biden in the lead, but by a smaller margin than the recent RMG Research survey of the Pine Tree state. That (and the lower than customary shares of support for both candidates) is (/are) owed in large part to the high number of respondents either remaining undecided or lining up behind another option in the survey. The shares may be off from other polling, but the margin is mostly consistent with other surveys that have been in the field in Maine albeit on the lower end of the range. The state of the statewide race is clear enough at this point, but the real focus should be on the districts (which Critical Insights included among the distinctions in this survey).


Maine CD1
(Biden 49, Trump 33):
However, only one of those district is competitive and it is not the first, where Biden continues to lead by double digits. That is unlikely to change between now and election day. Yes, the margin is less here than in the recent Quinnipiac survey, but there are methodological reasons that better explain that than any tightening of the race.


Maine CD2
(Biden 39, Trump 38):
To the extent, then, that Maine holds any interest in the race to 270, it is because the fight for the one electoral vote in Maine's second is competitive. Trump carried the district by 10 points in 2016, but that advantage has disappeared when comparing the 2020 polling there to the election results four years ago. Biden now has the upper hand for that electoral vote but by less than one point in the FHQ averages. That is enough to keep the district on the Watch List below, but only just barely. And, while limited, the polling thus far in the second has produce a very narrow range of results. At least the  Senate in Maine race will provide future data on the state of the presidential race in the second district (so long as pollsters continue to break the race down in that manner).


Minnesota
(Biden 51, Trump 49):
Over in the Land of 10,000 Lakes, Emerson was in the field with a survey that showed the race closer to where things stood in 2016 than has been true of the polling conducted there so far in 2020. And the answer as to why is simple enough. With leaners pushed toward one candidate or the other, the president's share is at its zenith in 2020 polling of the state. Biden has been at or above 50 in most of the Minnesota polls, but Trump has yet to be north of 44 percent in any survey until this one. Take it in isolation for what it is worth.


North Carolina
(Trump 48, Biden 47 via Pulse Opinion Research | Biden 47, Trump 37 via HIT Strategies | Biden 49, Trump 46 via Public Policy Polling):
North Carolina saw a flurry of poll releases since yesterday's update here at FHQ and it really was a choose your own adventure series of surveys ranging from Trump +1 to Biden +10. Both are on the tails of the range of surveys out of the Tar Heel state. FHQ currently has the race at Biden 47, Trump 45 and the PPP survey is the closest of those three, but all three polls are pretty close to where Biden is. It is the Trump share that is more variable.


Wisconsin
(Biden 50, Trump 46):
Finally, in the Badger state, Marquette Law School had its first update on the state of the presidential race since a poll from last June. In the likely voters version with leaners included, Biden lost some ground between then and now, but the margin is on the lower end of the range in polls released in August there. FHQ currently has the race in Wisconsin pegged at Biden 48.6 and Trump at 42.5, so this survey (again with leaners) has Trump running a bit more ahead of his average than Biden is.


NOTE: A description of the methodology behind the graduated weighted average of 2020 state-level polling that FHQ uses for these projections can be found here.


The Electoral College Spectrum1
MA-112
(14)
NJ-14
(173)
WI-10
(252)
AK-3
(125)
UT-6
(60)
HI-4
(18)
OR-7
(180)
PA-203
NE CD2-1
(273 | 286)
MO-10
(122)
IN-11
(54)
CA-55
(73)
DE-3
(183)
FL-29
(302 | 265)
SC-9
(112)
ID-4
(43)
VT-3
(76)
CO-9
(192)
NV-6
(308 | 236)
MT-3
(103)
KY-8
(39)
NY-29
(105)
NM-5
(197)
AZ-11
(319 | 230)
NE CD1-1
KS-6
(100)
AL-9
(31)
WA-12
(117)
ME-2
(199)
NC-15
(334 | 219)
MS-6
(93)
ND-3
(22)
MD-10
(127)
VA-13
(212)
ME CD2-1
OH-18
(353 | 204)
LA-8
(87)
SD-3
(19)
IL-20
(147)
MN-10
(222)
GA-16
(185)
AR-6
(79)
OK-7
(16)
ME CD1-1
RI-4
(152)
MI-16
(238)
IA-6
(169)
NE-2
(73)
WV-5
(9)
CT-7
(159)
NH-4
(242)
TX-38
(163)
TN-11
(71)
WY-3
NE CD3-1
(4)
1 Follow the link for a detailed explanation on how to read the Electoral College Spectrum.

2 The numbers in the parentheses refer to the number of electoral votes a candidate would have if he or she won all the states ranked prior to that state. If, for example, Trump won all the states up to and including Pennsylvania (Biden's toss up states plus the Pennsylvania), he would have 286 electoral votes. Trump's numbers are only totaled through the states he would need in order to get to 270. In those cases, Biden's number is on the left and Trumps's is on the right in bold italics.


To keep the figure to 50 cells, Washington, DC and its three electoral votes are included in the beginning total on the Democratic side of the spectrum. The District has historically been the most Democratic state in the Electoral College.

3 Pennsylvania
 is the state where Biden crosses the 270 electoral vote threshold to win the presidential election, the tipping point state.

Another pretty robust day of polling releases, and yet the changes were limited. Importantly, Georgia and Iowa switch places with Georgia moving up against the partisan line, less than two tenths of a point from jumping to Biden turf. Maine's first district also basically shifted back to where it was on the Electoral College Spectrum back on August 5. And that change is not really of all that much consequence. The first remains a safe bet for the Democratic ticket in November.

On the Watch List below, Minnesota came off on the weight of a poll that reduced the margin there enough to lodge it more deeply in the Lean Biden category. The 14 states below and underpolled Nevada remain the states to watch. New polling from any of them are most likely to change the outlook in the graphics here at FHQ.

--
There were no new polls from Nevada today.

Days since the last Nevada poll was in the field: 103.

--
NOTE: Distinctions are made between states based on how much they favor one candidate or another. States with a margin greater than 10 percent between Biden and Trump are "Strong" states. Those with a margin of 5 to 10 percent "Lean" toward one of the two (presumptive) nominees. Finally, states with a spread in the graduated weighted averages of both the candidates' shares of polling support less than 5 percent are "Toss Up" states. The darker a state is shaded in any of the figures here, the more strongly it is aligned with one of the candidates. Not all states along or near the boundaries between categories are close to pushing over into a neighboring group. Those most likely to switch -- those within a percentage point of the various lines of demarcation -- are included on the Watch List below.

The Watch List1
State
Potential Switch
Florida
from Toss Up Biden
to Lean Biden
Georgia
from Toss Up Trump
to Toss Up Biden
Iowa
from Toss Up Trump
to Toss Up Biden
Kansas
from Lean Trump
to Strong Trump
Louisiana
from Strong Trump
to Lean Trump
Maine CD2
from Toss Up Biden
to Toss Up Trump
Mississippi
from Strong Trump
to Lean Trump
Missouri
from Toss Up Trump
to Lean Trump
Nebraska CD1
from Lean Trump
to Strong Trump
Nebraska CD2
from Lean Biden
to Toss Up Biden
Ohio
from Toss Up Biden
to Toss Up Trump
Pennsylvania
from Lean Biden
to Toss Up Biden
South Carolina
from Lean Trump
to Toss Up Trump
Virginia
from Strong Biden
to Lean Biden
1 Graduated weighted average margin within a fraction of a point of changing categories.

--
Methodological Note: In past years, FHQ has tried some different ways of dealing with states with no polls or just one poll in the early rounds of these projections. It does help that the least polled states are often the least competitive. The only shortcoming is that those states may be a little off in the order in the Spectrum. In earlier cycles, a simple average of the state's three previous cycles has been used. But in 2016, FHQ strayed from that and constructed an average swing from 2012 to 2016 that was applied to states. That method, however, did little to prevent anomalies like the Kansas poll that had Clinton ahead from biasing the averages. In 2016, the early average swing in the aggregate was  too small to make much difference anyway. For 2020, FHQ has utilized an average swing among states that were around a little polled state in the rank ordering on election day in 2016. If there is just one poll in Delaware in 2020, for example, then maybe it is reasonable to account for what the comparatively greater amount of polling tells us about the changes in Connecticut, New Jersey and New Mexico. Or perhaps the polling in Iowa, Mississippi and South Carolina so far tells us a bit about what may be happening in Alaska where no public polling has been released. That will hopefully work a bit better than the overall average that may end up a bit more muted.


--
Related posts:
The Electoral College Map (8/10/20)

The Electoral College Map (8/9/20)

The Electoral College Map (8/7/20)


Follow FHQ on TwitterInstagram and Facebook or subscribe by Email.

Monday, August 10, 2020

The Electoral College Map (8/10/20)

Update for August 10.


Changes (August 10)
StateBeforeAfter
Nebraska CD1
Strong Trump
Lean Trump
Tomorrow marks the last day of presidential primary season and with that the countdown to election day in November ticks down to just 12 weeks. But the new work week began today -- 85 days until November 3 -- with some mainly status quo-maintaining survey releases and one surprise.


Polling Quick Hits:
Arizona (Biden 49, Trump 45 via OH Predictive Insights | Trump 46, Biden 45 via Trafalgar Group):
In the Grand Canyon state, a pair of polls were fairly consistent on Donald Trump's position in the mid-40s but diverged on where Biden sits in the race for the state's 11 electoral votes. Not to dismiss the Trafalgar poll, but this was the first time the firm had been in the field in Arizona in 2020 and Phoenix-based OH Predictive has now conducted five polls this calendar year. That does not necessarily give the pollster special insight into Arizona, but that does provide a better timeline of how the race has evolved there since March. And the picture has been consistent: Biden up around 50 percent and Trump in the mid-40s. But while that is in line with where Trump has been positioned in most surveys, it is on the high end of where Biden has most often been. Trafalgar, on the other hand, has the former vice president near the low end of his share of support in the existing polling in Arizona. But again, the status quo was maintained here. Arizona remains a little more than Biden +3 at FHQ.


Maine (Biden 50, Trump 39):
Over in the Pine Tree state, RMG Research found the race for the two at-large electoral votes there to favor Biden as well. And the survey was on par with the graduated weighted average shares for both candidates and margin at FHQ. There, Biden sits at 51 percent and Trump at just over 40 percent. That is obviously not a significant difference. The real intrigue in Maine will not be statewide, however. It will be in the second congressional district. But as long as the Senate race there gets polled, there will be a steady stream of new data on the presidential race (statewide).


Michigan (Biden 47, Trump 43):
YouGov/University of Wisconsin completed a second wave of blue wall surveys and saw a tighter race in the Wolverine state than has been typical in most recent polling there. However, Biden led by the very same 47-43 back in February, so this one may show the race on the lower end of the range of recent outcomes but represents no change poll-over-poll from UW since around the time primary season kicked off.


Nebraska CD1 (Trump 48, Biden 46):
The surprise was out of Nebraska where an internal poll conducted by Strategies 360 for state Democrats found Trump ahead in the first congressional district by just two points. This is a district the president won by 20 points in 2016. This one is not to be confused with the more competitive second district around Omaha. State-level polling in 2020 has been about eight points more Democratic as measured by FHQ than was the case on election day in 2016. That is some important context for this poll which would indicate an 18 point shift toward Biden. That is shift of more than ten points more than the average across all states. This one feels a bit like the lone Arkansas survey that was released in June: a likely outlier but one that flags the district as one to watch. [NOTE: NE CD1 has been on and off the Watch List but straddling the Strong/Lean Trump line, not the competitive partisan line between the two candidates' coalitions of states.]


Pennsylvania (Biden 50, Trump 41):
The blue wall surveys from YouGov/UW also included surveys from Pennsylvania and Wisconsin a day after YouGov/CBS released polls from the pair. In the Keystone state the margin is a tad wider than yesterday's release, but well within what has been normal during the summer in Pennsylvania polling. Yet, since the first wave of these glimpses into this closest trio of states in February, the outlook has changed, shifting in Biden's direction. What was a narrow one point lead earlier this year is now a nine point advantage for the former vice president. Yes, that is on the higher end of the range of recent margins in the commonwealth, but it is in that range.


Wisconsin (Biden 49, Trump 43):
The story is much the same in Wisconsin. What was a two point edge favoring Biden in the February YouGov wave has now doubled (and nearly replicates the results from the YouGov poll from a day ago). But this poll is right in the heart of the range of summer polling in the Badger state. There are wider and narrower margins, but it all averages at FHQ to around Biden +6.2.


NOTE: A description of the methodology behind the graduated weighted average of 2020 state-level polling that FHQ uses for these projections can be found here.


The Electoral College Spectrum1
MA-112
(14)
NJ-14
(173)
WI-10
(252)
AK-3
(125)
UT-6
(60)
HI-4
(18)
OR-7
(180)
PA-203
NE CD2-1
(273 | 286)
MO-10
(122)
IN-11
(54)
CA-55
(73)
DE-3
(183)
FL-29
(302 | 265)
SC-9
(112)
ID-4
(43)
VT-3
(76)
CO-9
(192)
NV-6
(308 | 236)
MT-3
(103)
KY-8
(39)
NY-29
(105)
NM-5
(197)
AZ-11
(319 | 230)
NE CD1-1
KS-6
(100)
AL-9
(31)
ME CD1-1
WA-12
(118)
ME-2
(199)
NC-15
(334 | 219)
MS-6
(93)
ND-3
(22)
MD-10
(128)
VA-13
(212)
ME CD2-1
OH-18
(353 | 204)
LA-8
(87)
SD-3
(19)
IL-20
(148)
MN-10
(222)
IA-6
(185)
AR-6
(79)
OK-7
(16)
RI-4
(152)
MI-16
(238)
GA-16
(179)
NE-2
(73)
WV-5
(9)
CT-7
(159)
NH-4
(242)
TX-38
(163)
TN-11
(71)
WY-3
NE CD3-1
(4)
1 Follow the link for a detailed explanation on how to read the Electoral College Spectrum.

2 The numbers in the parentheses refer to the number of electoral votes a candidate would have if he or she won all the states ranked prior to that state. If, for example, Trump won all the states up to and including Pennsylvania (Biden's toss up states plus the Pennsylvania), he would have 286 electoral votes. Trump's numbers are only totaled through the states he would need in order to get to 270. In those cases, Biden's number is on the left and Trumps's is on the right in bold italics.


To keep the figure to 50 cells, Washington, DC and its three electoral votes are included in the beginning total on the Democratic side of the spectrum. The District has historically been the most Democratic state in the Electoral College.

3 Pennsylvania
 is the state where Biden crosses the 270 electoral vote threshold to win the presidential election, the tipping point state.

Given that most of the polls today were consistent not only with current polling in this group of mainly battleground states, but also with the FHQ averages, little changed on either the Electoral College Spectrum or the Watch List. The only mover and shaker was that initial -- albeit internal Democratic -- poll out of Nebraska's first. Since it is the first poll there, the average remains tethered to the average swings in states that finished near NE CD1 on election day in 2016. That moved the district up the middle Republican column on the Spectrum and into Lean Trump territory. However, the district stays on the Watch List. It is just that now the most likely change is back into the Strong Trump category.

The rest of the List was unaltered from a day ago. Those states and underpolled Nevada continue to be the states to keep an eye on. New polling data could change how those states are classified here.

--
There were no new polls from Nevada today.

Days since the last Nevada poll was in the field: 102.

--
NOTE: Distinctions are made between states based on how much they favor one candidate or another. States with a margin greater than 10 percent between Biden and Trump are "Strong" states. Those with a margin of 5 to 10 percent "Lean" toward one of the two (presumptive) nominees. Finally, states with a spread in the graduated weighted averages of both the candidates' shares of polling support less than 5 percent are "Toss Up" states. The darker a state is shaded in any of the figures here, the more strongly it is aligned with one of the candidates. Not all states along or near the boundaries between categories are close to pushing over into a neighboring group. Those most likely to switch -- those within a percentage point of the various lines of demarcation -- are included on the Watch List below.

The Watch List1
State
Potential Switch
Florida
from Toss Up Biden
to Lean Biden
Georgia
from Toss Up Trump
to Toss Up Biden
Iowa
from Toss Up Trump
to Toss Up Biden
Kansas
from Lean Trump
to Strong Trump
Louisiana
from Strong Trump
to Lean Trump
Maine CD2
from Toss Up Biden
to Toss Up Trump
Minnesota
from Lean Biden
to Strong Biden
Mississippi
from Strong Trump
to Lean Trump
Missouri
from Toss Up Trump
to Lean Trump
Nebraska CD1
from Lean Trump
to Strong Trump
Nebraska CD2
from Lean Biden
to Toss Up Biden
Ohio
from Toss Up Biden
to Toss Up Trump
Pennsylvania
from Lean Biden
to Toss Up Biden
South Carolina
from Lean Trump
to Toss Up Trump
Virginia
from Strong Biden
to Lean Biden
1 Graduated weighted average margin within a fraction of a point of changing categories.

--
Methodological Note: In past years, FHQ has tried some different ways of dealing with states with no polls or just one poll in the early rounds of these projections. It does help that the least polled states are often the least competitive. The only shortcoming is that those states may be a little off in the order in the Spectrum. In earlier cycles, a simple average of the state's three previous cycles has been used. But in 2016, FHQ strayed from that and constructed an average swing from 2012 to 2016 that was applied to states. That method, however, did little to prevent anomalies like the Kansas poll that had Clinton ahead from biasing the averages. In 2016, the early average swing in the aggregate was  too small to make much difference anyway. For 2020, FHQ has utilized an average swing among states that were around a little polled state in the rank ordering on election day in 2016. If there is just one poll in Delaware in 2020, for example, then maybe it is reasonable to account for what the comparatively greater amount of polling tells us about the changes in Connecticut, New Jersey and New Mexico. Or perhaps the polling in Iowa, Mississippi and South Carolina so far tells us a bit about what may be happening in Alaska where no public polling has been released. That will hopefully work a bit better than the overall average that may end up a bit more muted.


--
Related posts:
The Electoral College Map (8/9/20)

The Electoral College Map (8/7/20)

The Electoral College Map (8/6/20)


Follow FHQ on TwitterInstagram and Facebook or subscribe by Email.

Sunday, August 9, 2020

The Electoral College Map (8/9/20)

Update for August 9.


With just 86 days until election day, the race for the White House has largely stabilized through the lens of FHQ's graduated weighted averages on the state level. That is particularly true in the most heavily polled states at or near the tipping point in the Electoral College. Of those states most likely to be the pivotal state -- Florida, Michigan, Pennsylvania and Wisconsin -- all currently have a margin right around or above five percent favoring Joe Biden. [Florida is just under five percent.]

And that outlook was not affected all that much by battleground tracking polls from YouGov in two of those states: Pennsylvania and Wisconsin.


Polling Quick Hits:
Pennsylvania (Biden 49, Trump 43):
YouGov was back in the field in the Keystone state and showed little movement one way or the other there. Actually, since the firm last polled the state in March the margin has stayed exactly as it is now: Biden +6. There was more movement between the February and March YouGov surveys than there was in the five months between March and now. Regardless, the advantage is consistent with other polls favoring Biden there of late. And the FHQ average margin for the former vice president stands at 5.1 points.


Wisconsin (Biden 48, Trump 42):
Meanwhile, further west in another blue wall state -- Wisconsin -- things appear similar on the surface. The six point edge Biden enjoys in Pennsylvania is replicated in the Badger state. However, the underlying movement within the polls YouGov has conducted in the state has been different. Whereas the increased Biden lead happened early -- between February and March -- in the sequence in Pennsylvania, that timeframe saw the status quo maintained in Wisconsin. Biden had the lead, but it was a much more modest two points that carried over from February at March. But the growth in Biden's margin over Trump expanded in the five months since the coronavirus really took hold here in the United States. That sort of shift has been felt in the FHQ averages in Wisconsin as well. The average margin there has pushed up to 6.21 points toward Biden. And the latest YouGov survey only confirmed that.


NOTE: A description of the methodology behind the graduated weighted average of 2020 state-level polling that FHQ uses for these projections can be found here.


The Electoral College Spectrum1
MA-112
(14)
NJ-14
(173)
WI-10
NE CD2-1
(253)
AK-3
(125)
UT-6
(60)
HI-4
(18)
OR-7
(180)
PA-203
(273 | 285)
MO-10
(122)
IN-11
(54)
CA-55
(73)
DE-3
(183)
FL-29
(302 | 265)
SC-9
(112)
ID-4
(43)
VT-3
(76)
CO-9
(192)
NV-6
(308 | 236)
MT-3
(103)
KY-8
(39)
NY-29
(105)
NM-5
(197)
AZ-11
(319 | 230)
KS-6
(100)
AL-9
(31)
ME CD1-1
WA-12
(118)
ME-2
(199)
NC-15
(334 | 219)
MS-6
(94)
ND-3
(22)
MD-10
(128)
VA-13
(212)
ME CD2-1
OH-18
(353 | 204)
LA-8
NE CD1-1
(88)
SD-3
(19)
IL-20
(148)
MN-10
(222)
IA-6
(185)
AR-6
(79)
OK-7
(16)
RI-4
(152)
MI-16
(238)
GA-16
(179)
NE-2
(73)
WV-5
(9)
CT-7
(159)
NH-4
(242)
TX-38
(163)
TN-11
(71)
WY-3
NE CD3-1
(4)
1 Follow the link for a detailed explanation on how to read the Electoral College Spectrum.

2 The numbers in the parentheses refer to the number of electoral votes a candidate would have if he or she won all the states ranked prior to that state. If, for example, Trump won all the states up to and including Pennsylvania (Biden's toss up states plus the Pennsylvania), he would have 285 electoral votes. Trump's numbers are only totaled through the states he would need in order to get to 270. In those cases, Biden's number is on the left and Trumps's is on the right in bold italics.


To keep the figure to 50 cells, Washington, DC and its three electoral votes are included in the beginning total on the Democratic side of the spectrum. The District has historically been the most Democratic state in the Electoral College.

3 Pennsylvania
 is the state where Biden crosses the 270 electoral vote threshold to win the presidential election, the tipping point state.

Since both new YouGov surveys were in line with not only recent polling in those states but the overall FHQ averages in both, little changed here. Both continue to be Lean Biden states and Pennsylvania also has continued to hold down the distinction of being the tipping point state. That that is true says much about the state of the race. A number of the states Trump will need to get close to 270 are toss ups, but the one(s) he need(s) to crest above that threshold are now more than five points away from him.

Needless to say both the Electoral College Spectrum above and the Watch List below remained as they were for the last update on Friday.

--
There were no new polls from Nevada today.

Days since the last Nevada poll was in the field: 101.

--
NOTE: Distinctions are made between states based on how much they favor one candidate or another. States with a margin greater than 10 percent between Biden and Trump are "Strong" states. Those with a margin of 5 to 10 percent "Lean" toward one of the two (presumptive) nominees. Finally, states with a spread in the graduated weighted averages of both the candidates' shares of polling support less than 5 percent are "Toss Up" states. The darker a state is shaded in any of the figures here, the more strongly it is aligned with one of the candidates. Not all states along or near the boundaries between categories are close to pushing over into a neighboring group. Those most likely to switch -- those within a percentage point of the various lines of demarcation -- are included on the Watch List below.

The Watch List1
State
Potential Switch
Florida
from Toss Up Biden
to Lean Biden
Georgia
from Toss Up Trump
to Toss Up Biden
Iowa
from Toss Up Trump
to Toss Up Biden
Kansas
from Lean Trump
to Strong Trump
Louisiana
from Strong Trump
to Lean Trump
Maine CD2
from Toss Up Biden
to Toss Up Trump
Minnesota
from Lean Biden
to Strong Biden
Mississippi
from Strong Trump
to Lean Trump
Missouri
from Toss Up Trump
to Lean Trump
Nebraska CD1
from Strong Trump
to Lean Trump
Nebraska CD2
from Lean Biden
to Toss Up Biden
Ohio
from Toss Up Biden
to Toss Up Trump
Pennsylvania
from Lean Biden
to Toss Up Biden
South Carolina
from Lean Trump
to Toss Up Trump
Virginia
from Strong Biden
to Lean Biden
1 Graduated weighted average margin within a fraction of a point of changing categories.

--
Methodological Note: In past years, FHQ has tried some different ways of dealing with states with no polls or just one poll in the early rounds of these projections. It does help that the least polled states are often the least competitive. The only shortcoming is that those states may be a little off in the order in the Spectrum. In earlier cycles, a simple average of the state's three previous cycles has been used. But in 2016, FHQ strayed from that and constructed an average swing from 2012 to 2016 that was applied to states. That method, however, did little to prevent anomalies like the Kansas poll that had Clinton ahead from biasing the averages. In 2016, the early average swing in the aggregate was  too small to make much difference anyway. For 2020, FHQ has utilized an average swing among states that were around a little polled state in the rank ordering on election day in 2016. If there is just one poll in Delaware in 2020, for example, then maybe it is reasonable to account for what the comparatively greater amount of polling tells us about the changes in Connecticut, New Jersey and New Mexico. Or perhaps the polling in Iowa, Mississippi and South Carolina so far tells us a bit about what may be happening in Alaska where no public polling has been released. That will hopefully work a bit better than the overall average that may end up a bit more muted.


--
Related posts:
The Electoral College Map (8/7/20)

The Electoral College Map (8/6/20)

The Electoral College Map (8/5/20)


Follow FHQ on TwitterInstagram and Facebook or subscribe by Email.