
Polling Quick Hits:
Arizona:
Data Orbital released the results of its first survey of the Grand Canyon state during 2020. And the polling outfit showed a much tighter race than most of the recent polling in the state. While Biden pulled in 47 percent support -- right around his current FHQ average share in the state -- Trump overperformed his average by a couple of points. But that is certainly within range of the margin of error. Yet, June polling has been much more Biden-favorable on the whole. Of the seven surveys that were in the field at least partially in June, only two (including this Data Orbital poll) had the race below Biden +4.
Colorado:
FHQ mentioned this in the first projection post two weeks ago, but if anyone had said in 2008 that Colorado would be anything other than a toss up state, then I would not have believed you. But here it is, three cycles later and the Centennial state looks to be far out of reach for Trump in the fall. It is firmly lodged in the Strong Biden category and the latest Public Policy Polling survey of the state did nothing to dissuade anyone of that conclusion. But for the first 2020 poll of the state back in February, Biden has been above 50 percent there all the way. Trump, on the other hand, finds himself closer to 40 percent. And the average margin in that once battleground state sits at just above 15 points in Biden's direction. The order of states is, on the whole, stable from election to election, but there can be movement and Colorado is a good example of that. Once often in the middle column on the Electoral College Spectrum below, Colorado is now deep into what is typically the middle ground of Democratic states.
Change Research (Arizona, Florida, Michigan, North Carolina, Pennsylvania and Wisconsin):
There is not a whole lot to say about this latest wave of battleground surveys from Change Research other than this certainly is not the same results as were pulled out of six states in the last wave in mid-June. This round found Biden north of 50 percent in five of the six states. And the only state where Biden was not above the majority threshold was Michigan, the battleground (or perhaps red 2016) state where Biden has most consistently been above 50 percent. Thirteen times out of 36 surveys conducted in the Wolverine state in 2020, Biden has been over 50 percent. That is nearly twice the number of surveys in which the former vice presidential was beyond that mark in the next closest state, Wisconsin. And that was more than twice as much as the number of times Biden held more than half of the support in polls in remaining four states.
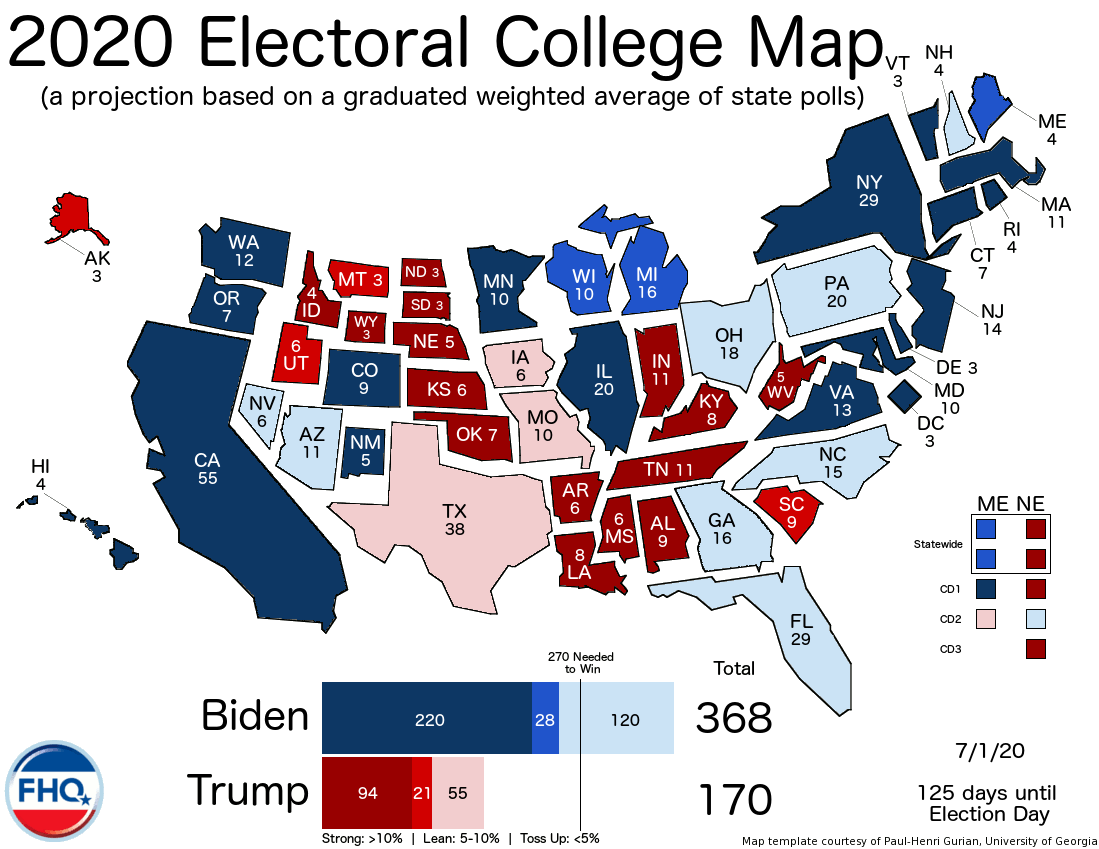
NOTE: A description of the methodology behind the graduated weighted average of 2020 state-level polling that FHQ uses for these projections can be found here.
The Electoral College Spectrum1
| ||||
MA-112
(14)
|
CT-7
(173)
|
NE CD2-1
PA-203
(269/289)
|
MO-10
(125)
|
NE-2
(56)
|
HI-4
(18)
|
OR-7
(180)
|
NH-43
(273/269)
|
AK-3
(115)
|
TN-11
(54)
|
CA-55
(73)
|
DE-3
(183)
|
FL-29
(302/265)
|
MT-3
(112)
|
AL-9
(43)
|
VT-3
(76)
|
CO-9
(192)
|
NV-6
(308/236)
|
SC-9
(109)
|
ID-4
(34)
|
NY-29
(105)
|
NM-5
(197)
|
AZ-11
(319/230)
|
UT-6
(100)
|
KY-8
(30)
|
MD-10
(115)
|
MN-10
(207)
|
NC-15
(334/219)
|
LA-8
NE CD1-1
(94)
|
ND-3
(22)
|
IL-20
(135)
|
VA-13
(220)
|
OH-18
(352/204)
|
MS-6
(85)
|
SD-3
(19)
|
WA-12
(147)
|
ME-2
(222)
|
GA-16
(368/186)
|
IN-11
(79)
|
OK-7
(16)
|
RI-4
ME CD1-1
(152)
|
MI-16
(238)
|
TX-38
(170)
|
KS-6
(68)
|
WV-5
(9)
|
NJ-14
(166)
|
WI-10
(248)
|
IA-6
ME CD2-1
(132)
|
AR-6
(62)
|
WY-3
NE CD3-1
(4)
|
1 Follow the link for a detailed explanation on how to read the Electoral College Spectrum.
2 The numbers in the parentheses refer to the number of electoral votes a candidate would have if he or she won all the states ranked prior to that state. If, for example, Trump won all the states up to and including Pennsylvania (Biden's toss up states up to the Keystone state), he would have 289 electoral votes. Trump's numbers are only totaled through the states he would need in order to get to 270. In those cases, Biden's number is on the left and Trumps's is on the right in bold italics. To keep the figure to 50 cells, Washington, DC and its three electoral votes are included in the beginning total on the Democratic side of the spectrum. The District has historically been the most Democratic state in the Electoral College. 3 New Hampshire is the state where Biden crosses the 270 electoral vote threshold to win the presidential election, the tipping point state for the former vice president. But because the line between New Hampshire and Pennsylvania creates an Electoral College tie (269-269), Pennsylvania is the tipping point state for Trump. It is where the president surpasses 270 electoral votes. Collectively, New Hampshire and Pennsylvania are the tipping point states. | ||||
Yes, there was a new wave of battleground polling, but it did little to change anything on the map, much less the Spectrum above or the Watch List below. Every state kept its same position on each as the calendar turned from June to July. [Only Maine rejoined the List, but not because of a poll of the Pine Tree state. Rather, with just one poll, Maine is tethered to other states that finished around it in 2016. There were enough changes in the states with polls today to shift Maine back onto the List.] Despite that polling, there were no changes, and that had much to do with how little variation there was in the margins across states in the Change Research surveys.
As it stands, July opens with New Hampshire and Pennsylvania as the tipping point states with the chance of an electoral college tie still on the table and Biden with a significant cushion beyond them among the toss up states on the Spectrum. And that cushion grew over June. But as a new month dawns, it remains to be seen whether that trajectory will continue or begin in any way to reverse course as the conventions approach next month.
--
NOTE: Distinctions are made between states based on how much they favor one candidate or another. States with a margin greater than 10 percent between Biden and Trump are "Strong" states. Those with a margin of 5 to 10 percent "Lean" toward one of the two (presumptive) nominees. Finally, states with a spread in the graduated weighted averages of both the candidates' shares of polling support less than 5 percent are "Toss Up" states. The darker a state is shaded in any of the figures here, the more strongly it is aligned with one of the candidates. Not all states along or near the boundaries between categories are close to pushing over into a neighboring group. Those most likely to switch -- those within a percentage point of the various lines of demarcation -- are included on the Watch List below.
The Watch List1
| |||
State
|
Switch
| ||
|---|---|---|---|
Florida
|
from Toss Up Biden
|
to Lean Biden
| |
Georgia
|
from Toss Up Biden
|
to Toss Up Trump
| |
Louisiana
|
from Strong Trump
|
to Lean Trump
| |
Maine
|
from Lean Biden
|
to Strong Biden
| |
Mississippi
|
from Strong Trump
|
to Lean Trump
| |
Nebraska CD1
|
from Strong Trump
|
to Lean Trump
| |
Nebraska CD2
|
from Toss Up Biden
|
to Lean Biden
| |
New Hampshire
|
from Toss Up Biden
|
to Lean Biden
| |
Ohio
|
from Toss Up Biden
|
to Toss Up Trump
| |
Pennsylvania
|
from Toss Up Biden
|
to Lean Biden
| |
South Carolina
|
from Lean Trump
|
to Strong Trump
| |
Utah
|
from Lean Trump
|
to Strong Trump
| |
Virginia
|
from Strong Biden
|
to Lean Biden
| |
Wisconsin
|
from Lean Biden
|
to Toss Up Biden
| |
1 Graduated weighted average margin within a fraction of a point of changing categories.
| |||
--
Methodological Note: In past years, FHQ has tried some different ways of dealing with states with no polls or just one poll in the early rounds of these projections. It does help that the least polled states are often the least competitive. The only shortcoming is that those states may be a little off in the order in the Spectrum. In earlier cycles, a simple average of the state's three previous cycles has been used. But in 2016, FHQ strayed from that and constructed an average swing from 2012 to 2016 that was applied to states. That method, however, did little to prevent anomalies like the Kansas poll that had Clinton ahead from biasing the averages. In 2016, the early average swing in the aggregate was too small to make much difference anyway. For 2020, FHQ has utilized an average swing among states that were around a little polled state in the rank ordering on election day in 2016. If there is just one poll in Delaware in 2020, for example, then maybe it is reasonable to account for what the comparatively greater amount of polling tells us about the changes in Connecticut, New Jersey and New Mexico. Or perhaps the polling in Iowa, Mississippi and South Carolina so far tells us a bit about what may be happening in Alaska where no public polling has been released. That will hopefully work a bit better than the overall average that may end up a bit more muted.
--
Related posts:
The Electoral College Map (6/30/20)
The Electoral College Map (6/29/20)
The Electoral College Map (6/26/20)
Follow FHQ on Twitter, Instagram and Facebook or subscribe by Email.
No comments:
Post a Comment